When it comes to tools that can aid you in drawing mathematical functions and presenting them graphically, there are plenty to choose from. However, most of them are specialized tools that are certainly not for novices. Most of the best ones are strictly mathematical programs such as MATLAB, which are pretty complex for people who are not that mathematically inclined.
Thankfully, there are some excellent tools out there that are not only free, but also give you an easy way to plot and draw math function and formula even if you’re not an expert. These come in handy for when you want to represent some type of numerical data in a visual way, like when presenting a report at work or a term paper in school.
Here are four great tools that you can use.
1) FooPlot
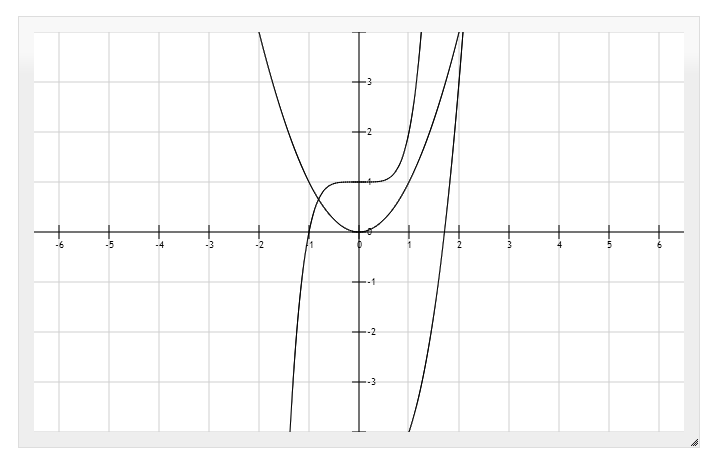
This is a fantastic online tool that lets you work from within your browser. It works with all browsers as well. Use it to easily plot not only functions and to find the roots and intersections of graphs. It’s great for any student or teacher that needs to not only plot out these functions, but also embed the image later for presentation. You can change the colors of the lines and when you are done, you can transfer the drawings into a presentation program like Microsoft PowerPoint or save it as an image file or PDF.
2) Graph
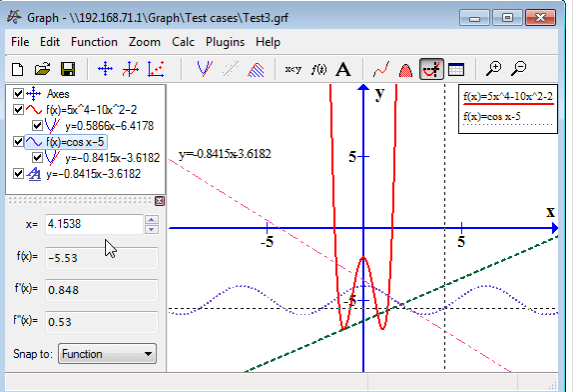
If you would rather work with an online tool than a web browser-based one, Graph might be the perfect one for you. It’s an open source application that is very lightweight and installs in no time at all. You can use it to draw graphs of functions in a coordinate system and create visuals very easily that you will also be able to later place into another program for presentation.
3) Graph Sketch
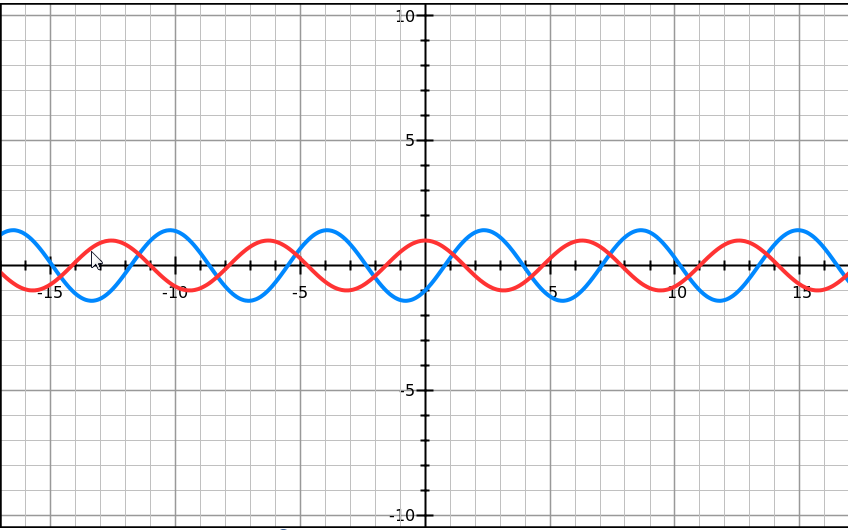
Graph Sketch is an online tool that is similar to FooPlot and might be even easier to use. All you need to do is enter your equation, choose some settings to personalize your graph and then create it. It also allows you to save your graphs directly to your computer so that you can use them in worksheets and presentations. You can also create a permanent link for your graph that you can share with others via URL.
4) Graphing in Excel
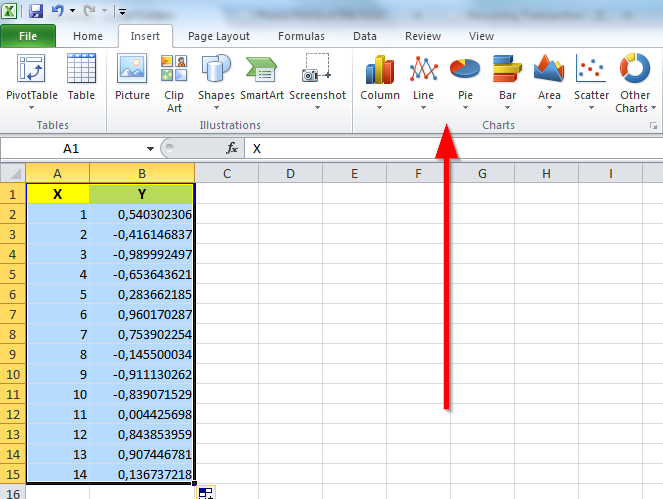
If you have Microsoft Excel installed on your computer, you can use the program to create graphs from functions. You need to have the values for all independent variable X in order to calculate the dependent variable Y and show this in your spreadsheet.
To do this, make sure that you enter the data in two adjacent columns, and make sure that the X data is in the left column.
Now position the cursor at the top of the X column, click and hold the left mouse button and drag the cursor to the bottom of the Y column to select everything.
Once all of the data has been selected, click on Insert > Chart and choose the box that reads “XY (Scatter)“ and click Next.
Now click on the X-Y pattern without lines and then click Next.
Give your graph a name by clicking on Chart Title and labeling it.
Now click separately on the “Category (X)” and “Value (Y)” boxes and type a label for each.
Select “As New Sheet“ and then click on Next.
Now click Finish to create your X-Y plot of the data.


