When code is not working as it should, it can be hard to locate the error if you have multiple lines of code. Hours can be spent searching for the mistake, without success. To avoid such situations, it can be helpful to use some of the debugging tools that come with Microsoft Excel.
Run Code Step by Step
It certainly won’t be easy to find the problem if you run your code all at once. Running each step of the process one by one can help you identify where the bottleneck is. Here’s how you can do it.
Open your code, select the first line and press F8.
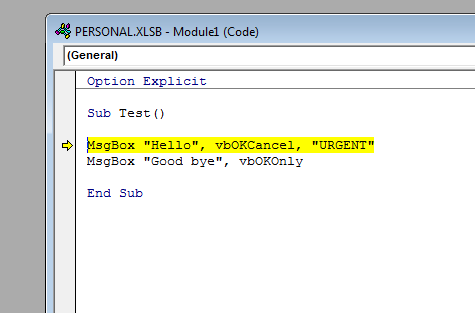
The line will turn yellow. Press F8 once more and the yellow mark will move to the next line. Every time you press F8, the next line will be executed. If you have loops in your code, each step in the process will be executed one by one. For example, if you have 100 iterations, you will be able to follow each of them. This process can be extremely useful in testing and running your code.
Pause Code Execution
While testing a pretty long code, sometimes you want to pause and inspect what has been done thus far. To do that you need to select a line of code which will serve as pause, and press F9 or click on the Toggle Breakpoint.
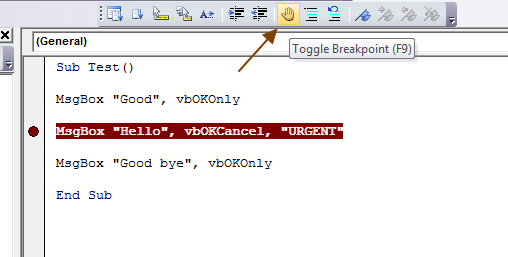
Once you click Run, the code will make a pause there and you can investigate your variables and output value. All pauses are marked with dark red color. Make sure to delete them after you have finished debugging.
Immediate Window
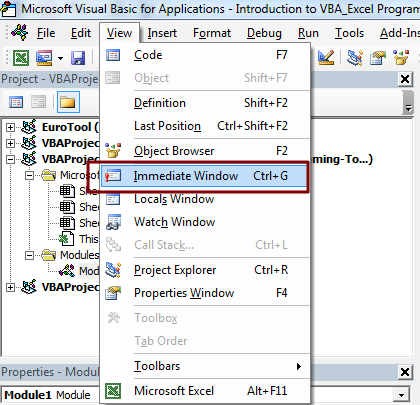
After you have paused your code, you can do some more experimenting before continuing. You can do that in Immediate Window. To turn it on, go to View – Immediate Window.
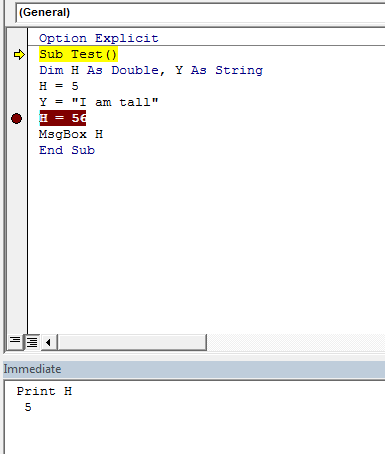
Here you can print the value of all variables or perform some more commands outside the main code for your own testing.
There are other advanced ways for code debugging, but for beginners this will be more than enough. The need for debugging will occur often, which is something that every developer will tell you.


