Today we are going to show you how to turn on the statistical analysis add-in in MS Excel.
Excel is excellent when it comes to financial analysis, creating reports, and performing calculations. However, Excel can perform some simple statistical analysis as well. Maybe not in full detail like SPSS or R, but for the most basic statistical analysis it will be adequate.
The best thing about using Excel for this purpose is that you don’t have to use complicated formulas (though you certainly can, if you want to). Everything is done automatically: you enter data, choose a required statistical tool and results are presented to you. Now, all you need to do is analyze them using your knowledge of statistics.
You can work with ANOVA, histograms, t-tests, correlations, descriptive statistics, regression and much more.
Here is how you can start working on it.
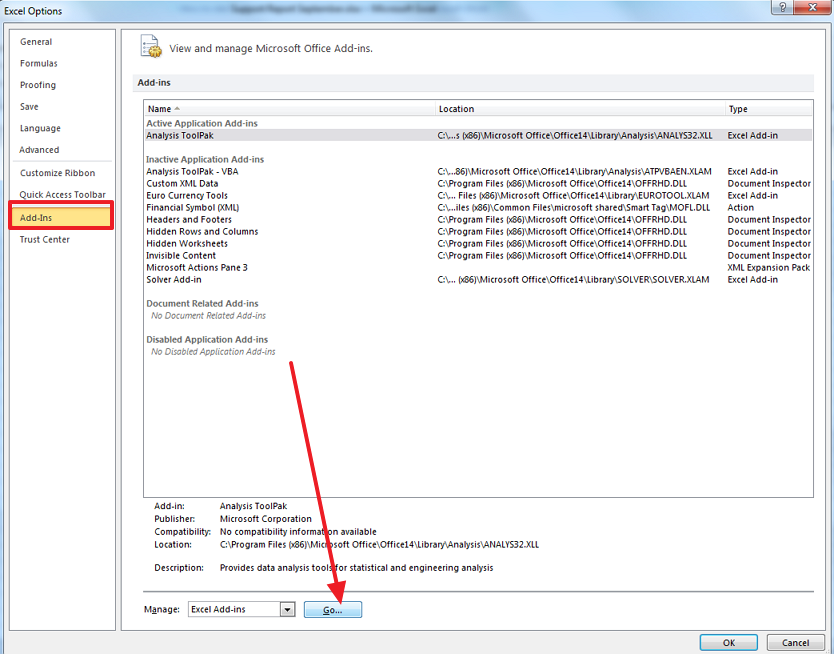
Go to Options in your Excel document.

Navigate to the tab Add-ins and click on Go, as you see in the image.
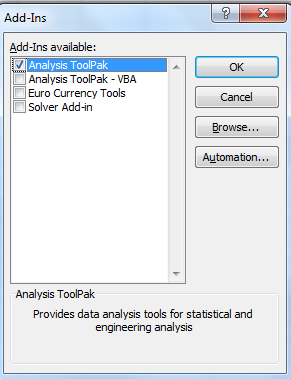
Activate the Analysis ToolPak, then click OK.
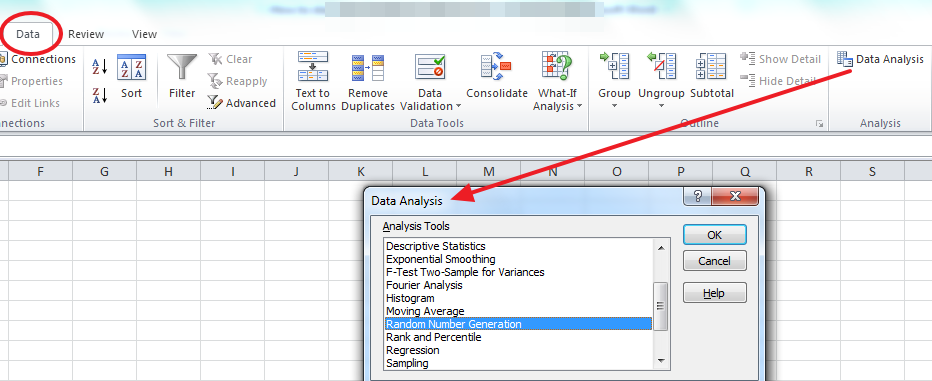
Now a new button will appear under you Data menu.
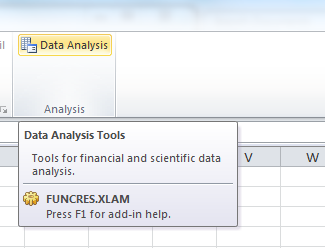
The tab will be called Data Analysis, and you can click on it to start performing statistical analysis in Excel.


