We have already explained how Microsoft Excel can be used as a basic statistical analysis software. The first step in the process requires turning on the Statistical Analysis feature, after which you can perform linear regression, ANOVA and much more.
Unfortunately, for a more serious analysis users need specialized software such as SPSS, Eviews or Stata. These programs are expensive and not everyone can afford them. Luckily, there are plenty of free alternatives that can be used instead. Here we have created a list of the most popular free software for statistical analysis.
1) The R Project for Statistical Computing
R is by far the most widely used free statistical environment. It can be used for many different types of analysis. It has a large community and numerous packages are developed for it. Learning it will require a bit of programming knowledge, but there are plenty of tutorials and online courses available for that purpose. This is something we definitely recommend you learn, because it is slow-ly becoming the standard in many professional data analytics communities.
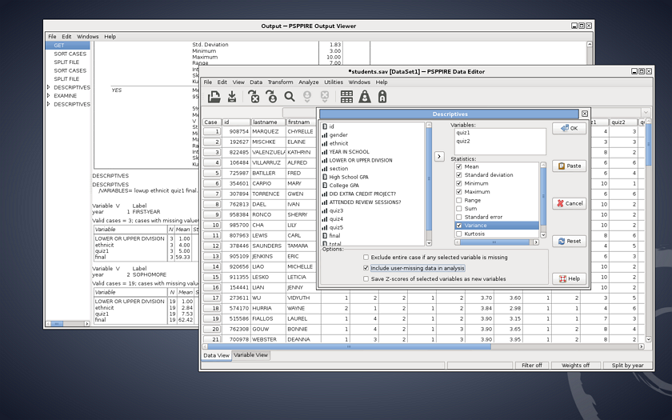
2) PSPP
This is a free alternative for SPSS, and a pretty mature project which can be used for regression analysis, non-parametric tests, T-tests, cluster analysis and much more. It supports over 1 billion variables.
3) Gretl
Gretl is a free alternative to Eviews. It can be used for a wide range of econometric analyses, data series and regression.
4) MicrOsiris
MicrOsiris is a lightweight freeware for performing all sorts of data analysis.
5) Regressit
A completely free add-in for Excel, Regressit can be used for multivariate descriptive data analysis and multiple linear regression analysis.
6) MacAnova
MacAnova is developed at the University of Minnesota and can be used for statistical analysis and matrix algebra.
7) GNU Octave
This tool presents an excellent alternative to Matlab. Not only can it be used for multiple numerical computations, it also has great data visualization capabilities.
8) Dmelt
This tool is a successor to a couple of other statistical environments. It can be used for mathematical analysis, visualization and much more.


