Microsoft Office’s SmartArt Graphics is a powerful feature that is often underused.When writing a document or creating a presentation, it is always recommended to present information and concepts in a visual way. This allows the reader to better comprehend everything you are trying to say. Your readers or audience will be more easily engaged if you use graphics and visualization. The point of the report or presentation that you are sending to your boss or teacher will be clearer and more concise. On the other hand, if you want to present your information better to your students to ensure that they understand concepts correctly, using visualizations is a must.
Microsoft Office has all you need for creating visualizations, diagrams and plans. There is no need to use external software when everything you need is in the software itself. All you need to do is choose an appropriate SmartArt graphic.
There is a wide variety of choices. There are choices for graphics that can be used to present information in the form of a list, a process, hierarchy, a circle, pyramid, and relationships in an efficient and appealing way.
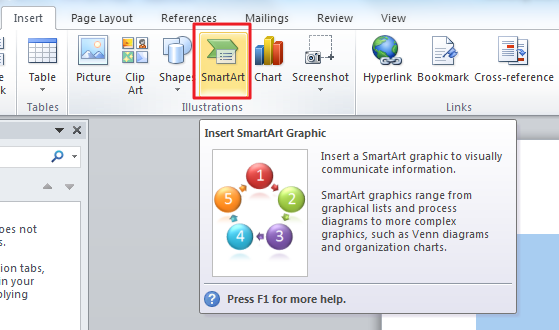
All you need to do is to go to Insert – SmartArt and choose the appropriate graphic. You will probably need to experiment with a couple of different ones, but without a doubt, you will find one that fits your needs exactly.
1) Inserting Text
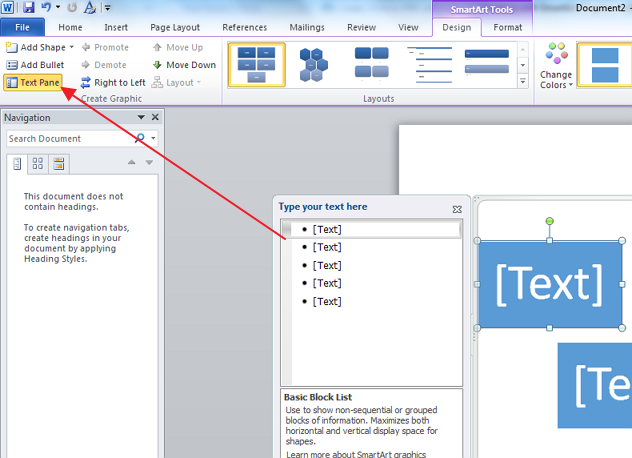
Inserting text is easy. All you need to do is click on the Shape and enter the text.
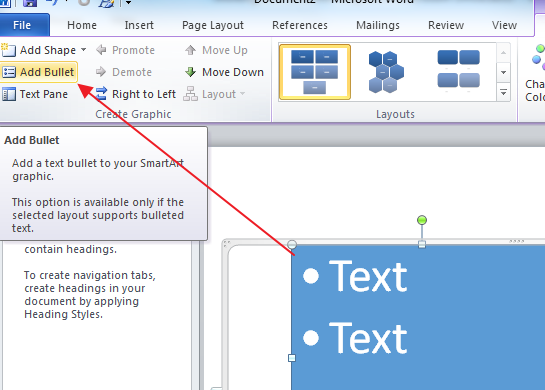
You can also enter bullet points by clicking on SmartArt Tools – Design – Insert bullets.
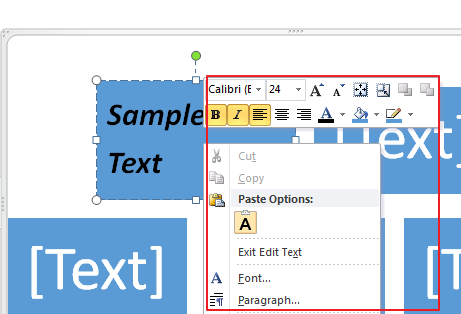
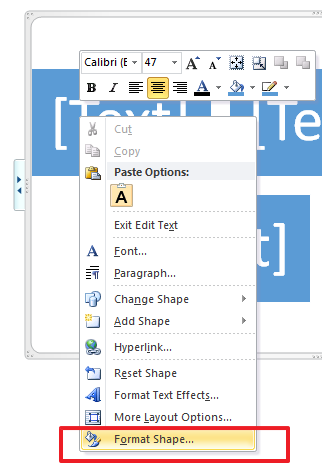
To change the text color, font size, or other details, simply right click on the Shape.
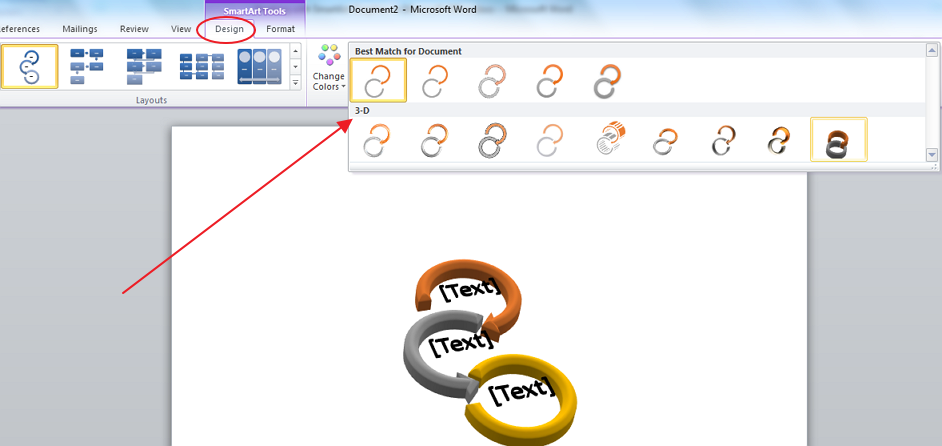
2) Implementing 3-D graphs
You can turn every graph that you insert into a 3D graph by going to SmartArt Tools – Design – Styles, and choosing one of the 3D options.
3) Change SmartArt Graphics’ color
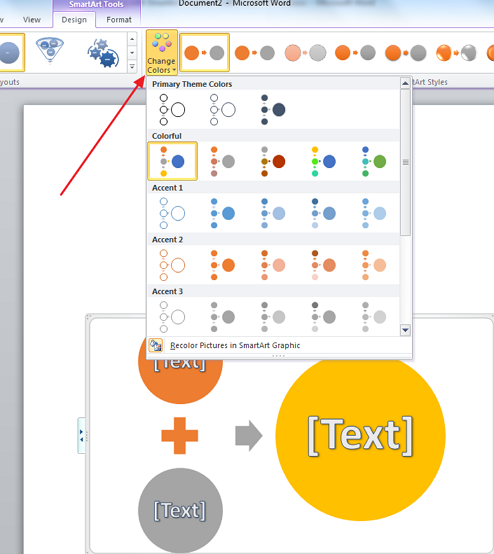
If you don’t like the default blue color of the graph, you can easily change it by simply going to SmartArt Tools, and choosing the option Change Color.
4) Change color and layout of specific shape
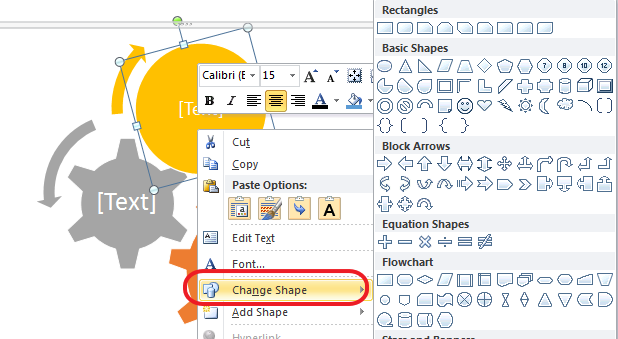
Right click on each shape to see all of the available options for change. You can change the shape look, layout, color, transparency, edges and more. This is especially useful in cases where you want to have shapes of different color in order to differentiate between subjects.
5) Add new shapes
Sometimes you want to add more levels of shapes in SmartArt Graphics. For examples instead of 4 elements in a circle, you would want to have 5 elements.
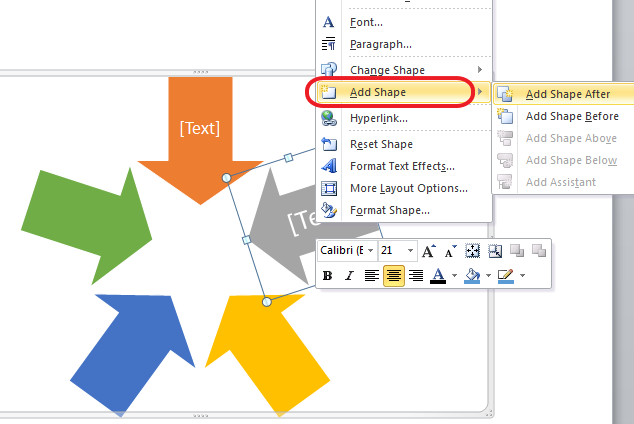
This can easily be done by going to SmartArt Tools – Design – Add Shape, or by right-clicking the Shape – Add Shape – Add Shape After/Before.


