In the following article, you will learn how to add error bars in Excel along with some useful tips and tricks on managing them.
Microsoft Excel is a computer program that is part of the bigger Microsoft 365 suite. The program consists of an arrangement of rows and columns that work like spreadsheets and facilitate the handling and interpretation of basically any type of data. It is also very customizable so each user can make it work according to his specific requirements.
MS Excel is mostly used for detailed data recording, as well as text processing and advanced calculations using mathematical functions. As if this is not enough, MS Excel also offers all the necessary tools to create beautiful graphs to present the desired information in a more visual and understandable way.
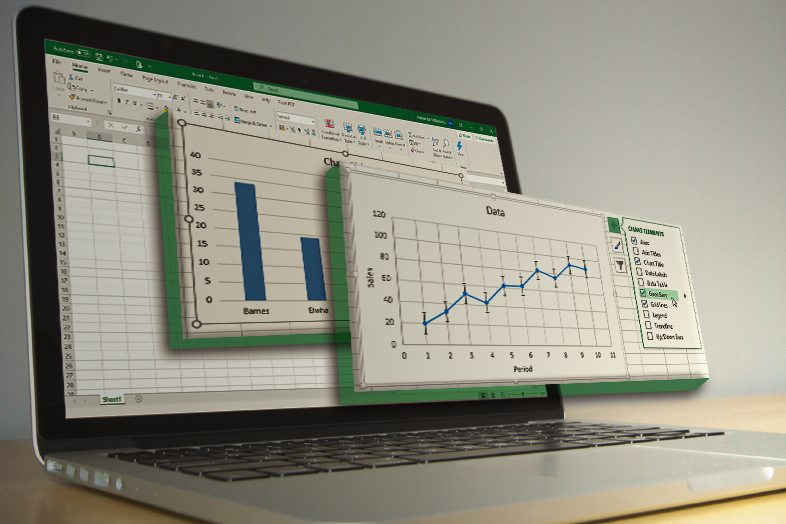
Moreover, the spreadsheet software has an interesting feature known as “error bars” which are basically a graphical representation of data variability. Simply said, they represent the precision of a measurement. Error bars usually show standard deviation or margin of error (how far the true value is from the determined one). We invite you to follow along and learn how to add error bars in Excel.
Types of Error Bars in Excel
There are three different types of error bars in Excel and in this part, we will go through each of them individually so you would have a better understanding of their meanings.
“Standard Error” error bar:
As the name suggests, it represents a standard error of the mean for all of the values in the chart. What we mean by that is that it shows how far the mean of the data is likely to be from the true value (true population mean).
“Percentage” error bar:
This one is fairly simple and straightforward. It shows the percentage variation for each data point. For example, if the percentage error bars have a 5% value and the data point value is 100 then the error bar will be somewhere between 95 and 105.
“Standard Deviation” error bar:
This error bar shows how close the bar is to the mean of the dataset. Microsoft Excel by default puts 1 as the value of the standard deviation, but you can change this manually if you want by going into the “More Options” menu.
“Fixed Value” error bar:
This shows the error bars where the margin of error is fixed. For example, you can specify the error bars to be 50 units, and then it will create error bars whose values will vary between -50 and + 50 units.
“Custom” error bar:
This one is great if you want to put your own custom error bars where you can specify the upper and lower limits for each data point. You can choose to keep the custom range the same for all of the error bars or you can individually customize each error bar. This can be very useful if you expect to have different variability for different data points.
Now we are ready to dive in and show you how to add error bars in Excel.
How to Add Error Bars in Excel
How to add error bars in Excel 2019, 2016 and 2013
Step 1:
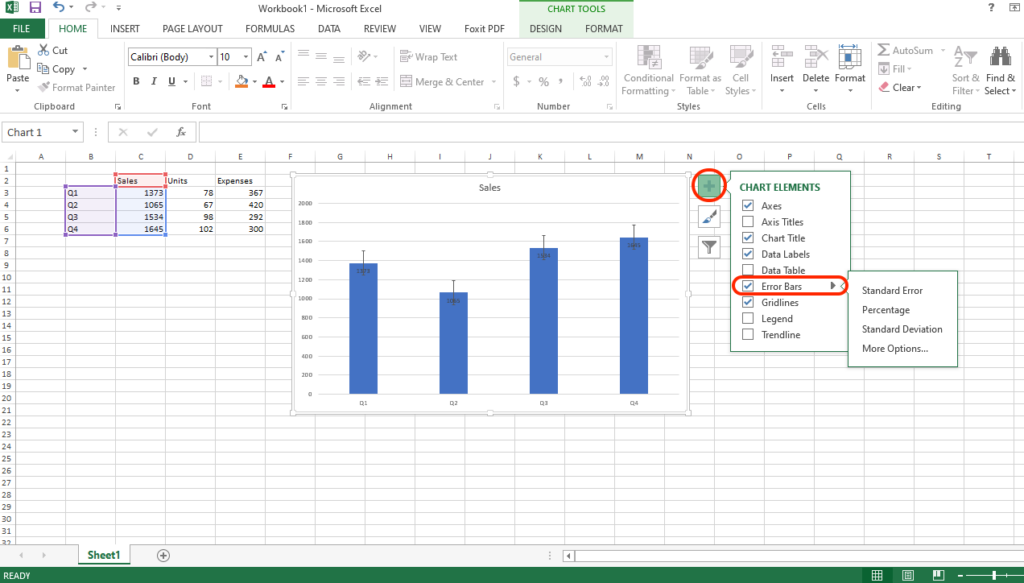
Click anywhere on the chart and three icons will show on the right next to the chart.
Step 2:
Click on the “+” icon and the “Chart Elements” menu will appear.
Step 3:
Thick the error bars checkbox and click on the black triangle that will appear once you hover the cursor over the error bars option.
Step 4:
Now you only have to choose the error bar you want from the 3 available options: Standard Error, Percentage, or Standard Deviation (we explained each of them above).
How to add error bars in Excel 2010 and 2007
Step 1:
Click anywhere on the chart to activate the “Chart Tools” bar.
Step 2:
In the “Analysis group” which is under the “Layout tab” click on the “Error Bars” option and choose one of the following: Standard Error, Percentage, or Standard Deviation.
How to add error bars in Excel on macOS
Step 1:
Click anywhere on the chart to activate the “Chart Design” bar.
Step 2:
On the left side of the “Chart Design” tab click on the “Add Chart Element” option, then hover the cursor over the “Error Bars” menu and choose one of the following: Standard Error, Percentage, or Standard Deviation.

How to Delete Error bars in Excel
Deleting error bars in Excel is as easy as unthinking the error bar checkbox from the Chart Elements menu (Excel 2019, 2016 and 2013) or selecting “None” from the Error Bars menu (Excel 2010, 2007 and macOS).
We hope you enjoyed reading this article and that from now on you will be able to add error bars in Excel without any problems. If you want to learn more about Excel, feel free to visit an Excel dedicated page on our blog where we talk about the best and most useful Excel tips and tricks.


