If you are using Excel, you have probably learned so far to make a graph. Graph makes your data look much better and visible. Your document users would have less difficulties to understand and interpret the data. Especially those who rely on their visual experience.
How can I make a graph?
It is very easy to make a graph in Excel. In case you don’t know how to do it, here is a short explanation below. Further in this text you will also learn how to make a graph in Google Sheets.
- Open Excel and insert data (any version of Excel)
- Select the data you want to present in the chart
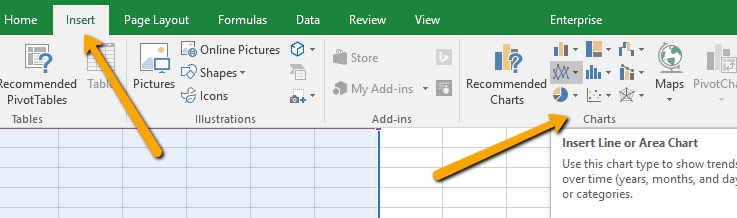
- Click on Insert button (next to the Home)
- Choose a chart
The chart will appear in your spreadsheet and you will be able to move it. Here you can find more details on how to embellish your charts.
How to Make a Graph in Google Sheets
You don’t need to be skilled with Excel, to learn how to make a graph in Google sheets. You just need to have a gmail account, online access and a little bit of patience to follow this guide.
Google Drive is very convenient because you can store files and have an online access to them whenever you need it. The same way you work in Microsoft Office suite, you can work in Google Docs and Google sheets.
Google sheets is very similar to MS Excel, and now you will see how similar is it to make a graph in Google Sheets.
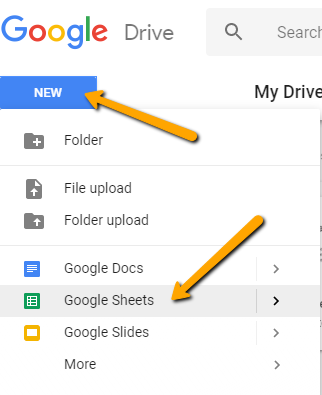
First, sign in to your gmail where your Google Sheets file is located. Or if you haven’t created a Google sheets file yet, click the New button in the Google Drive. Then click on Google Sheets as shown on the image above.
Then write data in your sheet and with the left mouse click, select only the data you want to present in one graph.
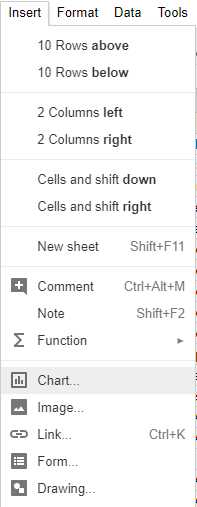
Click on the Insert menu and then on Chart.
The Chart editor will open on the right side of the screen. In the chart type drop-down menu, choose an appropriate chart. In this guide we will show you how to make a line graph in Google sheets.
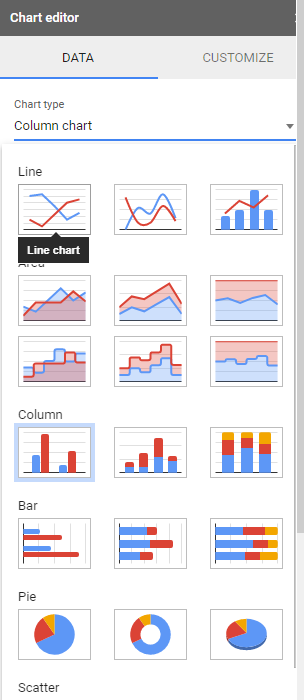
Select the Line Chart, which is the first chart to choose from. Then go to Customize tab and set up other options.
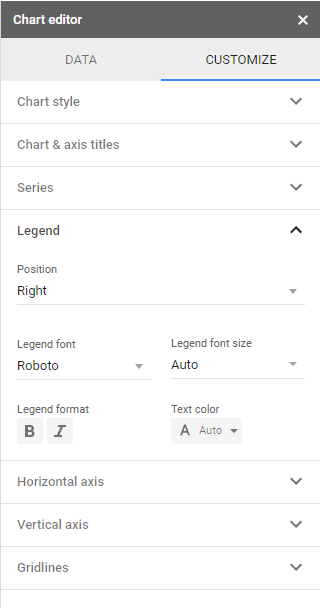
For instance, you can choose the font and its color, for every line individually. You can change the style of the graph and the look of the gridlines as well. Just click on the thing you want to change, for instance gridlines, and you will see all options.
Did you get it?
Google Drive can be useful when you are away from the office or home computer and you need to finish something. It is also convenient if you are working with someone else in the same document. So one way or another, it wouldn’t hurt if you learn how to make a graph in Google Sheets. Your data will be presented visually, even though you didn’t use Excel.


