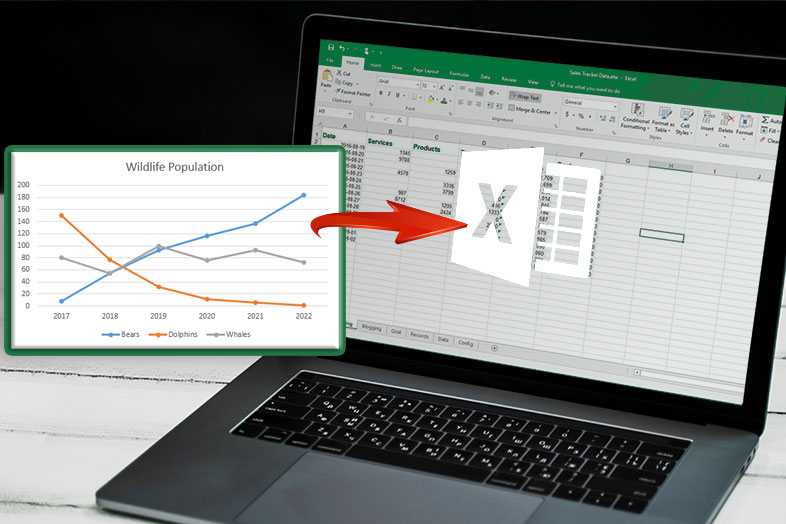
In addition to data entry and data collection, Excel is even better for data visualization. With Excel charts and line graphs you can present the data in a way it turns complex statistics into easily understandable information. Excel charts are the best choice for presenting ratios and proportions, but if you want to present data in a timeline you should make a line graph. If you wonder how to make a line graph in Excel, don’t look any further. Here we will show you how to do it on desktop and mobile devices.
How to make a line graph in Excel on mobile devices
You can make a line graph with various mobile apps such as Graph, Chart Maker, Numbers, EasyChart. If you prefer to work in Excel, here’s how to do it. The following guide works on iOS, Android and Windows mobile devices.
- Select the data in your Excel workbook by dragging the small green circles to the left or right.
- (For tablet users) Tap on the Insert menu.
(For smartphone users) Tap on the Edit icon, then on Home and finally on Insert.
- Tap on Recommended button and find the Line chart there. If you cannot find the preferred design of Line chart in the Recommended designs, click on the Chart button and you will find it there.
- Once you insert a line graph in Excel, you will see the options to copy, paste, delete, move the chart, and even switch to see the alternative views.
How to make a line graph in Excel on your desktop
- Enter the data you want to present in a line graph.
- With the left mouse click, select the data and click on Insert.
- In the Insert toolbar, there will be a section called Charts.
- Click on the line graph icon to open the additional menu with a range or line graph designs.
- By clicking on the preferred line graph, it will show up in the spreadsheet presenting the data you selected.
Editing a line graph in Excel
You can use the Design menu to additional tweak your line graph, and you can resize the graph by using the circles on the edges of the graph. To move the line graph, click on it and then drag it by holding the left mouse click.
To edit data in a line graph, make the changes in the cell, where you entered the data initially. Once you press the Enter key the line graph will be updated.
If you need to change the title of your line graph, simply click on it and make the changes. Once you click out of the title space, the changes will be saved.
To change the color, line type, dash type, click on the line graph exactly where you want to make the changes and an additional window will pop up. Click on Color, to change it, or on the Dash type to change the dash.
Feel free to play with the chart settings, by changing the look of lines, their transparency etc. Your data will stand out for sure and even complex data will be easier to comprehend.


